Multi-Step Vegas SuperTrend - strategy [presentTrading]Long time no see! I am back : ) Please allow me to gain some warm-up.
█ Introduction and How it is Different
The "Vegas SuperTrend Strategy" is an enhanced trading strategy that leverages both the Vegas Channel and SuperTrend indicators to generate buy and sell signals.
What sets this strategy apart from others is its dynamic adjustment to market volatility and its multi-step take profit mechanism. Unlike traditional single-step profit-taking approaches, this strategy allows traders to systematically scale out of positions at predefined profit levels, thereby optimizing their risk-reward ratio and maximizing potential gains.
BTCUSD 6hr performance
█ Strategy, How it Works: Detailed Explanation
The Vegas SuperTrend Strategy combines the strengths of the Vegas Channel and SuperTrend indicators to identify market trends and generate trade signals. The following subsections delve into the details of how each component works and how they are integrated.
🔶 Vegas Channel Calculation
The Vegas Channel is based on a simple moving average (SMA) and the standard deviation (STD) of the closing prices over a specified period. The channel is defined by upper and lower bounds that are dynamically adjusted based on market volatility.
Simple Moving Average (SMA):
SMA_vegas = (1/N) * Σ(Close_i) for i = 0 to N-1
where N is the length of the Vegas Window.
Standard Deviation (STD):
STD_vegas = sqrt((1/N) * Σ(Close_i - SMA_vegas)^2) for i = 0 to N-1
Vegas Channel Upper and Lower Bounds:
VegasChannelUpper = SMA_vegas + STD_vegas
VegasChannelLower = SMA_vegas - STD_vegas
The details are here:
🔶 Trend Detection and Trade Signals
The strategy determines the current market trend based on the closing price relative to the SuperTrend bounds:
Market Trend:
MarketTrend = 1 if Close > SuperTrendPrevLower
-1 if Close < SuperTrendPrevUpper
Previous Trend otherwise
Trade signals are generated when there is a shift in the market trend:
Bullish Signal: When the market trend shifts from -1 to 1.
Bearish Signal: When the market trend shifts from 1 to -1.
🔶 Multi-Step Take Profit Mechanism
The strategy incorporates a multi-step take profit mechanism that allows for partial exits at predefined profit levels. This helps in locking in profits gradually and reducing exposure to market reversals.
Take Profit Levels:
The take profit levels are calculated as percentages of the entry price:
TakeProfitLevel_i = EntryPrice * (1 + TakeProfitPercent_i/100) for long positions
TakeProfitLevel_i = EntryPrice * (1 - TakeProfitPercent_i/100) for short positions
Multi-steps take profit local picture:
█ Trade Direction
The trade direction can be customized based on the user's preference:
Long: The strategy only takes long positions.
Short: The strategy only takes short positions.
Both: The strategy can take both long and short positions based on the market trend.
█ Usage
To use the Vegas SuperTrend Strategy, follow these steps:
Configure Input Settings:
- Set the ATR period, Vegas Window length, SuperTrend Multiplier, and Volatility Adjustment Factor.
- Choose the desired trade direction (Long, Short, Both).
- Enable or disable the take profit mechanism and set the take profit percentages and amounts for each step.
█ Default Settings
The default settings of the strategy are designed to provide a balanced approach to trading. Below is an explanation of each setting and its effect on the strategy's performance:
ATR Period (10): This setting determines the length of the ATR used in the SuperTrend calculation. A longer period smoothens the ATR, making the SuperTrend less sensitive to short-term volatility. A shorter period makes the SuperTrend more responsive to recent price movements.
Vegas Window Length (100): This setting defines the period for the Vegas Channel's moving average. A longer window provides a broader view of the market trend, while a shorter window makes the channel more responsive to recent price changes.
SuperTrend Multiplier (5): This base multiplier adjusts the sensitivity of the SuperTrend to the ATR. A higher multiplier makes the SuperTrend less sensitive, reducing the frequency of trade signals. A lower multiplier increases sensitivity, generating more signals.
Volatility Adjustment Factor (5): This factor dynamically adjusts the SuperTrend multiplier based on the width of the Vegas Channel. A higher factor increases the sensitivity of the SuperTrend to changes in market volatility, while a lower factor reduces it.
Take Profit Percentages (3.0%, 6.0%, 12.0%, 21.0%): These settings define the profit levels at which portions of the trade are exited. They help in locking in profits progressively as the trade moves in favor.
Take Profit Amounts (25%, 20%, 10%, 15%): These settings determine the percentage of the position to exit at each take profit level. They are distributed to ensure that significant portions of the trade are closed as the price reaches the set levels, reducing exposure to reversals.
Adjusting these settings can significantly impact the strategy's performance. For instance, increasing the ATR period or the SuperTrend multiplier can reduce the number of trades, potentially improving the win rate but also missing out on some profitable opportunities. Conversely, lowering these values can increase trade frequency, capturing more short-term movements but also increasing the risk of false signals.
Tìm kiếm tập lệnh với "take profit"

Zero-lag TEMA Crosses Strategy[Pakun]Here's the adjusted strategy description in English, aligned with the house rules:
---
### Strategy Name: Zero-lag TEMA Cross Strategy
**Purpose:** This strategy aims to identify entry and exit points in the market using Zero-lag Triple Exponential Moving Averages (TEMA). It focuses on minimizing lag and improving the accuracy of trend-following signals.
### Uniqueness and Usefulness
**Uniqueness:** This strategy employs the less commonly used Zero-lag TEMA, compared to standard moving averages. This unique approach reduces lag and provides more timely signals.
**Usefulness:** This strategy is valuable for traders looking to capture trend reversals or continuations with reduced lag. It has the potential to enhance the profitability and accuracy of trades.
### Entry Conditions
**Long Entry:**
- **Condition:** A crossover occurs where the short-term Zero-lag TEMA surpasses the long-term Zero-lag TEMA.
- **Signal:** A buy signal is generated, indicating a potential uptrend.
**Short Entry:**
- **Condition:** A crossunder occurs where the short-term Zero-lag TEMA falls below the long-term Zero-lag TEMA.
- **Signal:** A sell signal is generated, indicating a potential downtrend.
### Exit Conditions
**Exit Strategy:**
- **Stop Loss:** Positions are closed if the price moves against the trade and hits the predefined stop loss level. The stop loss is set based on recent highs/lows.
- **Take Profit:** Positions are closed when the price reaches the profit target. The profit target is calculated as 1.5 times the distance between the entry price and the stop loss level.
### Risk Management
**Risk Management Rules:**
- This strategy incorporates a dynamic stop loss mechanism based on recent highs/lows over a specified period.
- The take profit level ensures a reward-to-risk ratio of 1.5 times the stop loss distance.
- These measures aim to manage risk and protect capital.
**Account Size:** ¥500,000
**Commissions and Slippage:** 94 pips per trade and 1 pip slippage
**Risk per Trade:** 1% of account equity
### Configurable Options
**Configurable Options:**
- Lookback Period: The number of bars to calculate recent highs/lows.
- Fast Period: Length of the short-term Zero-lag TEMA (69).
- Slow Period: Length of the long-term Zero-lag TEMA (130).
- Signal Display: Option to display buy/sell signals on the chart.
- Bar Color: Option to change bar colors based on trend direction.
### Adequate Sample Size
**Sample Size Justification:**
- To ensure the robustness and reliability of the strategy, it should be tested with a sufficiently long period of historical data.
- It is recommended to backtest across multiple market cycles to adapt to different market conditions.
- This strategy was backtested using 10 days of historical data, including 184 trades.
### Notes
**Additional Considerations:**
- This strategy is designed for educational purposes and should be thoroughly tested in a demo environment before live trading.
- Settings should be adjusted based on the asset being traded and current market conditions.
### Credits
**Acknowledgments:**
- The concept and implementation of Zero-lag TEMA are based on contributions from technical analysts and the trading community.
- Special thanks to John Doe for the TEMA concept.
- Thanks to Zero-lag TEMA Crosses .
- This strategy has been enhanced by adding new filtering algorithms and risk management rules to the original TEMA code.
### Clean Chart Description
**Chart Appearance:**
- This strategy provides a clean and informative chart by plotting Zero-lag TEMA lines and optional entry/exit signals.
- The display of signals and color bars can be toggled to declutter the chart, improving readability and analysis.

Bollinger Bands Enhanced StrategyOverview
The common practice of using Bollinger bands is to use it for building mean reversion or squeeze momentum strategies. In the current script Bollinger Bands Enhanced Strategy we are trying to combine the strengths of both strategies types. It utilizes Bollinger Bands indicator to buy the local dip and activates trailing profit system after reaching the user given number of Average True Ranges (ATR). Also it uses 200 period EMA to filter trades only in the direction of a trend. Strategy can execute only long trades.
Unique Features
Trailing Profit System: Strategy uses user given number of ATR to activate trailing take profit. If price has already reached the trailing profit activation level, scrip will close long trade if price closes below Bollinger Bands middle line.
Configurable Trading Periods: Users can tailor the strategy to specific market windows, adapting to different market conditions.
Major Trend Filter: Strategy utilizes 100 period EMA to take trades only in the direction of a trend.
Flexible Risk Management: Users can choose number of ATR as a stop loss (by default = 1.75) for trades. This is flexible approach because ATR is recalculated on every candle, therefore stop-loss readjusted to the current volatility.
Methodology
First of all, script checks if currently price is above the 200-period exponential moving average EMA. EMA is used to establish the current trend. Script will take long trades on if this filtering system showing us the uptrend. Then the strategy executes the long trade if candle’s low below the lower Bollinger band. To calculate the middle Bollinger line, we use the standard 20-period simple moving average (SMA), lower band is calculated by the substruction from middle line the standard deviation multiplied by user given value (by default = 2).
When long trade executed, script places stop-loss at the price level below the entry price by user defined number of ATR (by default = 1.75). This stop-loss level recalculates at every candle while trade is open according to the current candle ATR value. Also strategy set the trailing profit activation level at the price above the position average price by user given number of ATR (by default = 2.25). It is also recalculated every candle according to ATR value. When price hit this level script plotted the triangle with the label “Strong Uptrend” and start trail the price at the middle Bollinger line. It also started to be plotted as a green line.
When price close below this trailing level script closes the long trade and search for the next trade opportunity.
Risk Management
The strategy employs a combined and flexible approach to risk management:
It allows positions to ride the trend as long as the price continues to move favorably, aiming to capture significant price movements. It features a user-defined ATR stop loss parameter to mitigate risks based on individual risk tolerance. By default, this stop-loss is set to a 1.75*ATR drop from the entry point, but it can be adjusted according to the trader's preferences.
There is no fixed take profit, but strategy allows user to define user the ATR trailing profit activation parameter. By default, this stop-loss is set to a 2.25*ATR growth from the entry point, but it can be adjusted according to the trader's preferences.
Justification of Methodology
This strategy leverages Bollinger bangs indicator to open long trades in the local dips. If price reached the lower band there is a high probability of bounce. Here is an issue: during the strong downtrend price can constantly goes down without any significant correction. That’s why we decided to use 200-period EMA as a trend filter to increase the probability of opening long trades during major uptrend only.
Usually, Bollinger Bands indicator is using for mean reversion or breakout strategies. Both of them have the disadvantages. The mean reversion buys the dip, but closes on the return to some mean value. Therefore, it usually misses the major trend moves. The breakout strategies usually have the issue with too high buy price because to have the breakout confirmation price shall break some price level. Therefore, in such strategies traders need to set the large stop-loss, which decreases potential reward to risk ratio.
In this strategy we are trying to combine the best features of both types of strategies. Script utilizes ate ATR to setup the stop-loss and trailing profit activation levels. ATR takes into account the current volatility. Therefore, when we setup stop-loss with the user-given number of ATR we increase the probability to decrease the number of false stop outs. The trailing profit concept is trying to add the beat feature from breakout strategies and increase probability to stay in trade while uptrend is developing. When price hit the trailing profit activation level, script started to trail the price with middle line if Bollinger bands indicator. Only when candle closes below the middle line script closes the long trade.
Backtest Results
Operating window: Date range of backtests is 2020.10.01 - 2024.07.01. It is chosen to let the strategy to close all opened positions.
Commission and Slippage: Includes a standard Binance commission of 0.1% and accounts for possible slippage over 5 ticks.
Initial capital: 10000 USDT
Percent of capital used in every trade: 30%
Maximum Single Position Loss: -9.78%
Maximum Single Profit: +25.62%
Net Profit: +6778.11 USDT (+67.78%)
Total Trades: 111 (48.65% win rate)
Profit Factor: 2.065
Maximum Accumulated Loss: 853.56 USDT (-6.60%)
Average Profit per Trade: 61.06 USDT (+1.62%)
Average Trade Duration: 76 hours
These results are obtained with realistic parameters representing trading conditions observed at major exchanges such as Binance and with realistic trading portfolio usage parameters.
How to Use
Add the script to favorites for easy access.
Apply to the desired timeframe and chart (optimal performance observed on 4h BTC/USDT).
Configure settings using the dropdown choice list in the built-in menu.
Set up alerts to automate strategy positions through web hook with the text: {{strategy.order.alert_message}}
Disclaimer:
Educational and informational tool reflecting Skyrex commitment to informed trading. Past performance does not guarantee future results. Test strategies in a simulated environment before live implementation

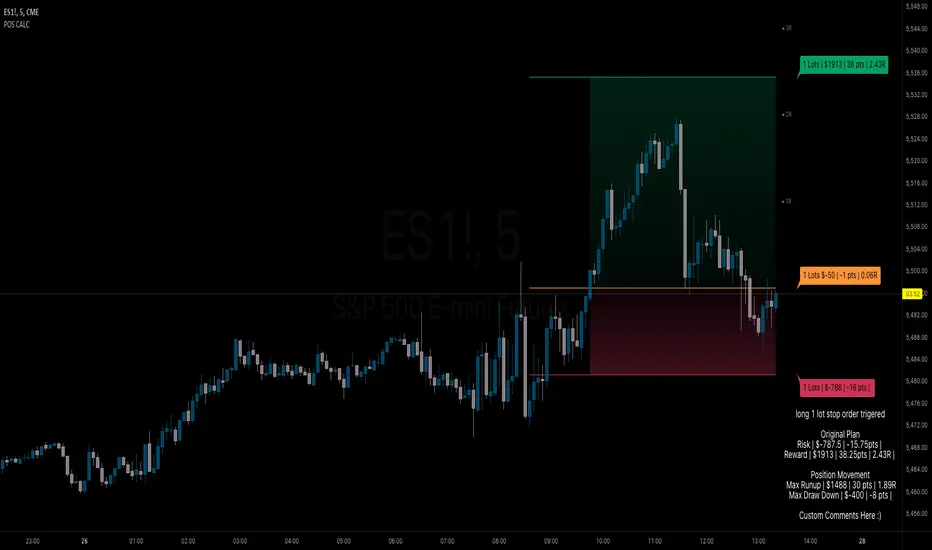
BB Position CalculatorPosition Size Calculator Instructions
Overview
The Position Size Calculator is designed to help traders automatically determine the appropriate lot size based on the dollar amount they are willing to risk. It includes features for automatic lot sizing, fixed lot risk calculations, take profit calculations (both automatic and fixed), max run-up, and max drawdown. Calculated values are displayed in ticks, points, and USD.
Key Features
• Automatic Lot Sizing: Automatically calculates lot size based on the amount of money you are willing to risk.
• Fixed Lot Risk Calculations: Provides risk calculations for fixed lot sizes.
• Take Profit Calculations: Offers both automatic and fixed take profit calculations.
• Max Run-Up and Max Drawdown: Monitors and displays the maximum run-up and drawdown of your trade.
• Detailed Metrics: Displays all calculated values in ticks, points, and USD.
Setup Instructions
1. Add and Remove for Each Position: The calculator is designed to be added to your chart for each new position. Once your preferences are set the first time, save them as your default to retain your settings for future use.
2. Adding the Indicator to Favorites:
• Use the TradingView keyboard shortcut “/” then type “pos.”
• Use the arrow key to select the Position Size Calculator and press enter.
• Close the indicator selection pop-up.
3. Setting the Trigger Price:
• A blue pop-up labeled “SET TRIGGER PRICE” will appear at the bottom of the chart.
• Click on the chart at the price level where you want to enter the trade.
4. Setting the Stop Loss:
• The pop-up will change to “SET STOP LOSS.”
• Click on the chart at the price level where your stop loss will be set.
5. Setting the Take Profit:
• The pop-up will change to “SET TAKE PROFIT.”
• Click on the chart at the price level where you want to take profit. If you have selected the option to overwrite with a set risk/reward ratio (R:R), the calculation will use this price level.
6. Setting the Trade Window Start:
• The pop-up will change to “SET TRADE WINDOW START.”
• Click on the bar in time where you want the indicator to start monitoring for price to trigger the position.
7. Adjusting the Position:
• Clicking on any part of the indicator will display draggable lines, allowing you to fine-tune the position that was previously plotted by the first four chart clicks.
Additional Notes
• Compatibility: This calculator has only been tested with futures trading.
• Customization: Once your preferences are set, save them as your default to make setup quicker for future trades.
• Support: If you have any questions or feature requests, please feel free to reach out.
Fractal Breakout Trend Following StrategyOverview
The Fractal Breakout Trend Following Strategy is a trend-following system which utilizes the Willams Fractals and Alligator to execute the long trades on the fractal's breakouts which have a high probability to be the new uptrend phase beginning. This system also uses the normalized Average True Range indicator to filter trades after a large moves, because it's more likely to see the trend continuation after a consolidation period. Strategy can execute only long trades.
Unique Features
Trend and volatility filtering system: Strategy uses Williams Alligator to filter the counter-trend fractals breakouts and normalized Average True Range to avoid the trades after large moves, when volatility is high
Configurable Trading Periods: Users can tailor the strategy to specific market windows, adapting to different market conditions.
Flexible Risk Management: Users can choose the stop-loss percent (by default = 3%) for trades, but strategy also has the dynamic stop-loss level using down fractals.
Methodology
The strategy places stop order at the last valid fractal breakout level. Validity of this fractal is defined by the Williams Alligator indicator. If at the moment of time when price breaking the last fractal price is higher than Alligator's teeth line (8 period SMA shifted 5 bars in the future) this is a valid breakout. Moreover strategy has the additional volatility filtering system using normalized ATR. It calculates the average normalized ATR for last user-defined number of bars and if this value lower than the user-defined threshold value the long trade is executed.
When trade is opened, script places the stop loss at the price higher of two levels: user defined stop-loss from the position entry price or down fractal validation level. The down fractal is valid with the rule, opposite as the up fractal validation. Price shall break to the downside the last down fractal below the Willians Alligator's teeth line.
Strategy has no fixed take profit. Exit level changes with the down fractal validation level. If price is in strong uptrend trade is going to be active until last down fractal is not valid. Strategy closes trade when price hits the down fractal validation level.
Risk Management
The strategy employs a combined approach to risk management:
It allows positions to ride the trend as long as the price continues to move favorably, aiming to capture significant price movements. It features a user-defined stop-loss parameter to mitigate risks based on individual risk tolerance. By default, this stop-loss is set to a 3% drop from the entry point, but it can be adjusted according to the trader's preferences.
Justification of Methodology
This strategy leverages Williams Fractals to open long trade when price has broken the key resistance level to the upside. This resistance level is the last up fractal and is shall be broken above the Williams Alligator's teeth line to be qualified as the valid breakout according to this strategy. The Alligator filtering increases the probability to avoid the false breakouts against the current trend.
Moreover strategy has an additional filter using Average True Range(ATR) indicator. If average value of ATR for the last user-defined number of bars is lower than user-defined threshold strategy can open the long trade according to open trade condition above. The logic here is following: we want to open trades after period of price consolidation inside the range because before and after a big move price is more likely to be in sideways, but we need a trend move to have a profit.
Another one important feature is how the exit condition is defined. On the one hand, strategy has the user-defined stop-loss (3% below the entry price by default). It's made to give users the opportunity to restrict their losses according to their risk-tolerance. On the other hand, strategy utilizes the dynamic exit level which is defined by down fractal activation. If we assume the breaking up fractal is the beginning of the uptrend, breaking down fractal can be the start of downtrend phase. We don't want to be in long trade if there is a high probability of reversal to the downside. This approach helps to not keep open trade if trend is not developing and hold it if price continues going up.
Backtest Results
Operating window: Date range of backtests is 2023.01.01 - 2024.05.01. It is chosen to let the strategy to close all opened positions.
Commission and Slippage: Includes a standard Binance commission of 0.1% and accounts for possible slippage over 5 ticks.
Initial capital: 10000 USDT
Percent of capital used in every trade: 30%
Maximum Single Position Loss: -3.19%
Maximum Single Profit: +24.97%
Net Profit: +3036.90 USDT (+30.37%)
Total Trades: 83 (28.92% win rate)
Profit Factor: 1.953
Maximum Accumulated Loss: 963.98 USDT (-8.29%)
Average Profit per Trade: 36.59 USDT (+1.12%)
Average Trade Duration: 72 hours
These results are obtained with realistic parameters representing trading conditions observed at major exchanges such as Binance and with realistic trading portfolio usage parameters.
How to Use
Add the script to favorites for easy access.
Apply to the desired timeframe and chart (optimal performance observed on 4h and higher time frames and the BTC/USDT).
Configure settings using the dropdown choice list in the built-in menu.
Set up alerts to automate strategy positions through web hook with the text: {{strategy.order.alert_message}}
Disclaimer:
Educational and informational tool reflecting Skyrex commitment to informed trading. Past performance does not guarantee future results. Test strategies in a simulated environment before live implementation

MAC Investor V3.0 [VK]This indicator combines multiple functionalities to assist traders in making informed decisions. It primarily uses Heikin Ashi candles, Moving Averages, and a Price Action Channel (PAC) to provide signals for entering and exiting trades. Here's a detailed breakdown:
Inputs
MAC Length: Sets the length for the PAC calculation.
Use Heikin Ashi Candles: Option to use Heikin Ashi candles for calculations.
Show Coloured Bars around MAC: Option to color bars based on their relation to the PAC.
Show Long/Short Signals: Options to display long and short signals.
Show MAs? : Option to show moving averages on the chart.
Show MAs Trend at the Bottom?: Option to show trend signals at the bottom of the chart.
MA Lengths: Length settings for three different moving averages.
Change MA Color Based on Direction?: Option to change the color of moving averages based on trend direction.
MA Higher TimeFrame: Allows setting a higher timeframe for moving averages.
Show SL-TP Lines: Option to display Stop Loss and Take Profit lines.
SL/TP Percentages: Set the percentages for Stop Loss and three levels of Take Profit.
Calculations and Features
Heikin Ashi Candles: Calculations are based on Heikin Ashi candle data if selected.
Price Action Channel (PAC): Uses Exponential Moving Averages (EMA) of the high, low, and close to create a channel.
Bar Coloring: Colors the bars based on their position relative to the PAC.
Long and Short Signals: Uses crossovers of the close price and PAC upper/lower bands to generate signals.
Moving Averages (MA): Plots three moving averages and colors them based on their trend direction.
Overall Trend Indicators: Uses triangles at the bottom of the chart to show the overall trend of the MAs.
Stop Loss and Take Profit Levels: Calculates and plots these levels based on user-defined percentages from the entry price.
Alerts: Provides alerts for long and short signals.
Use Cases and How to Use
Identifying Trends: The PAC helps to identify the trend direction. If the closing price is above the PAC upper band, it suggests an uptrend; if below the lower band, it suggests a downtrend.
Entering Trades: Use the long and short signals to enter trades. A long signal is generated when the closing price crosses above the PAC upper band, and a short signal is generated when it crosses below the PAC lower band.
Exit Strategies: Utilize the Stop Loss (SL) and Take Profit (TP) levels to manage risk and lock in profits. These levels are automatically calculated based on the entry price and user-defined percentages.
Trend Confirmation with MAs: The moving averages provide additional confirmation of the trend. When all three MAs are trending in the same direction (e.g., all green for an uptrend), it adds confidence to the trade signal.
Overall Trend Indicators: The triangles at the bottom of the chart show the overall trend direction of the MAs:
Green Triangle: All three MAs are trending upwards, indicating a strong uptrend.
Red Triangle: All three MAs are trending downwards, indicating a strong downtrend.
Yellow Triangle: Mixed signals from the MAs, indicating no clear trend.
Bar Coloring for Quick Analysis: The colored bars give a quick visual cue about the market condition, aiding in faster decision-making.
Alerts: Set up alerts to get notified when a long or short signal is generated, allowing you to act promptly without constantly monitoring the chart.
Maximizing Profit
To maximize profit with this indicator:
Follow the Signals: Use the long and short signals to time your entries. Ensure you follow the trend indicated by the PAC and MAs.
Risk Management: Always set your Stop Loss and Take Profit levels to manage risk. This will help you cut losses early and secure profits.
Confirm with MAs: Look for confirmation from the moving averages. When all MAs align with the signal, it indicates a stronger trend.
Overall Trend Indicators: Pay attention to the triangles at the bottom for overall trend confirmation. Only enter trades when the overall trend is in your favor.
Heikin Ashi for Smoothing: Use Heikin Ashi candles for smoother trends and fewer false signals.
Backtesting: Test the indicator on historical data to understand its performance and adjust settings as necessary.
Adapt to Market Conditions: Adjust the lengths of PAC and MAs based on the market's volatility and timeframe you are trading on.
How to Use the Indicator
Add to Chart: Add the indicator to your TradingView chart.
Configure Settings: Customize the input settings to fit your trading strategy and timeframe.
Monitor Signals: Watch for long and short signals and observe the trend direction with the PAC and MAs.
Check Overall Trend: Look at the triangles at the bottom of the chart to see the overall trend direction of the MAs.
Set Alerts: Configure alerts to get notified of new signals.
Manage Trades: Use the SL and TP levels to manage your trades effectively.

Wolf DCA CalculatorThe Wolf DCA Calculator is a powerful and flexible indicator tailored for traders employing the Dollar Cost Averaging (DCA) strategy. This tool is invaluable for planning and visualizing multiple entry points for both long and short positions. It also provides a comprehensive analysis of potential profit and loss based on user-defined parameters, including leverage.
Features
Entry Price: Define the initial entry price for your trade.
Total Lot Size: Specify the total number of lots you intend to trade.
Percentage Difference: Set the fixed percentage difference between each DCA point.
Long Position: Toggle to switch between long and short positions.
Stop Loss Price: Set the price level at which you plan to exit the trade to minimize losses.
Take Profit Price: Set the price level at which you plan to exit the trade to secure profits.
Leverage: Apply leverage to your trade, which multiplies the potential profit and loss.
Number of DCA Points: Specify the number of DCA points to strategically plan your entries.
How to Use
1. Add the Indicator to Your Chart:
Search for "Wolf DCA Calculator" in the TradingView public library and add it to your chart.
2. Configure Inputs:
Entry Price: Set your initial trade entry price.
Total Lot Size: Enter the total number of lots you plan to trade.
Percentage Difference: Adjust this to set the interval between each DCA point.
Long Position: Use this toggle to choose between a long or short position.
Stop Loss Price: Input the price level at which you plan to exit the trade to minimize losses.
Take Profit Price: Input the price level at which you plan to exit the trade to secure profits.
Leverage: Set the leverage you are using for the trade.
Number of DCA Points: Specify the number of DCA points to plan your entries.
3. Analyze the Chart:
The indicator plots the DCA points on the chart using a stepline style for clear visualization.
It calculates the average entry point and displays the potential profit and loss based on the specified leverage.
Labels are added for each DCA point, showing the entry price and the lots allocated.
Horizontal lines mark the Stop Loss and Take Profit levels, with corresponding labels showing potential loss and profit.
Benefits
Visual Planning: Easily visualize multiple entry points and understand how they affect your average entry price.
Risk Management: Clearly see your Stop Loss and Take Profit levels and their impact on your trade.
Customizable: Adapt the indicator to your specific strategy with a wide range of customizable parameters.

Crypto Realized Profits/Losses Extremes [AlgoAlpha]🌟🚀 Introducing the Crypto Realized Profits/Losses Extremes Indicator by AlgoAlpha 🚀🌟
Unlock the potential of cryptocurrency markets with our cutting-edge On-Chain Pine Script™ indicator, designed to highlight extreme realized profit and loss zones! 🎯📈
Key Features:
✨ Realized Profits/Losses Calculation: Uses real-time data from the blockchain to monitor profit and loss realization events.
📊 Multi-Crypto Compatibility: The Indicator is compatible on other Crypto tickers besides Bitcoin.
⚙️ Customizable Sensitivity: Adjust the look-back period, normalization period, and deviation thresholds to tailor the indicator to your trading style.
🎨 Visual Enhancements: Choose from a variety of colors for up and down trends, and toggle extreme profit/loss overlay for easy viewing.
🔔 Integrated Alerts: Set up alerts for high and extreme profit or loss conditions, helping you stay ahead of significant market movements.
🔍 How to Use:
🛠 Add the Indicator: Add the indicator to favorites. Customize settings like period lengths and deviation thresholds according to your needs.
📊 Market Analysis: Monitor the main oscillator and the bands to understand current profit and loss extremes in the market. When the oscillator is at the upper band, this means that the market is doing really well and traders/investors will be likely to take profit and cause a reversal. The opposite is true when the oscillator reaches the lower band. The main oscillator can also be used for trend analysis.
🔔 Set Alerts: Configure alerts to notify you when the market enters a zone of high profit or loss, or during trend changes, enabling timely decisions without constant monitoring.
How It Works:
The indicator calculates a normalized area under the RSI curve applied on on-chain data regarding the number of wallets in profit. It employs a custom "src" variable that aggregates data from the blockchain about profit and loss addresses, adapting to intraday or longer timeframes as needed. The main oscillator plots this normalized area, while the upper and lower bands are plotted based on a deviation metric to identify extreme conditions. Colored fills between these bands visually denote these zones. For interaction, the indicator plots bubbles for extreme profits or losses and provides optional bar coloring to reflect the current market trend.
🚀💹 Enjoy a comprehensive, customizable, and visually engaging tool that helps you stay ahead in the fast-paced crypto market!

Ichimoku Clouds Strategy Long and ShortOverview:
The Ichimoku Clouds Strategy leverages the Ichimoku Kinko Hyo technique to offer traders a range of innovative features, enhancing market analysis and trading efficiency. This strategy is distinct in its combination of standard methodology and advanced customization, making it suitable for both novice and experienced traders.
Unique Features:
Enhanced Interpretation: The strategy introduces weak, neutral, and strong bullish/bearish signals, enabling detailed interpretation of the Ichimoku cloud and direct chart plotting.
Configurable Trading Periods: Users can tailor the strategy to specific market windows, adapting to different market conditions.
Dual Trading Modes: Long and Short modes are available, allowing alignment with market trends.
Flexible Risk Management: Offers three styles in each mode, combining fixed risk management with dynamic indicator states for versatile trade management.
Indicator Line Plotting: Enables plotting of Ichimoku indicator lines on the chart for visual decision-making support.
Methodology:
The strategy utilizes the standard Ichimoku Kinko Hyo model, interpreting indicator values with settings adjustable through a user-friendly menu. This approach is enhanced by TradingView's built-in strategy tester for customization and market selection.
Risk Management:
Our approach to risk management is dynamic and indicator-centric. With data from the last year, we focus on dynamic indicator states interpretations to mitigate manual setting causing human factor biases. Users still have the option to set a fixed stop loss and/or take profit per position using the corresponding parameters in settings, aligning with their risk tolerance.
Backtest Results:
Operating window: Date range of backtests is 2023.01.01 - 2024.01.04. It is chosen to let the strategy to close all opened positions.
Commission and Slippage: Includes a standard Binance commission of 0.1% and accounts for possible slippage over 5 ticks.
Maximum Single Position Loss: -6.29%
Maximum Single Profit: 22.32%
Net Profit: +10 901.95 USDT (+109.02%)
Total Trades: 119 (51.26% profitability)
Profit Factor: 1.775
Maximum Accumulated Loss: 4 185.37 USDT (-22.87%)
Average Profit per Trade: 91.67 USDT (+0.7%)
Average Trade Duration: 56 hours
These results are obtained with realistic parameters representing trading conditions observed at major exchanges such as Binance and with realistic trading portfolio usage parameters. Backtest is calculated using deep backtest option in TradingView built-in strategy tester
How to Use:
Add the script to favorites for easy access.
Apply to the desired chart and timeframe (optimal performance observed on the 1H chart, ForEx or cryptocurrency top-10 coins with quote asset USDT).
Configure settings using the dropdown choice list in the built-in menu.
Set up alerts to automate strategy positions through web hook with the text: {{strategy.order.alert_message}}
Disclaimer:
Educational and informational tool reflecting Skyrex commitment to informed trading. Past performance does not guarantee future results. Test strategies in a simulated environment before live implementation

RSI & Backed-Weighted MA StrategyRSI & MA Strategy :
INTRODUCTION :
This strategy is based on two well-known indicators that work best together: the Relative Strength Index (RSI) and the Moving Average (MA). We're going to use the RSI as a trend-follower indicator, rather than a reversal indicator as most are used to. To the signals sent by the RSI, we'll add a condition on the chart's MA, filtering out irrelevant signals and considerably increasing our winning rate. This is a medium/long-term strategy. There's also a money management method enabling us to reinvest part of the profits or reduce the size of orders in the event of substantial losses.
RSI :
The RSI is one of the best-known and most widely used indicators in trading. Its purpose is to warn traders when an asset is overbought or oversold. It was designed to send reversal signals, but we're going to use it as a trend indicator by increasing its length to 20. The RSI formula is as follows :
RSI (n) = 100 - (100 / (1 + (H (n)/L (n))))
With n the length of the RSI, H(n) the average of days closing above the open and L(n) the average of days closing below the open.
MA :
The Moving Average is also widely used in technical analysis, to smooth out variations in an asset. The SMA formula is as follows :
SMA (n) = (P1 + P2 + ... + Pn) / n
where n is the length of the MA.
However, an SMA does not weight any of its terms, which means that the price 10 days ago has the same importance as the price 2 days ago or today's price... That's why in this strategy we use a RWMA, i.e. a back-weighted moving average. It weights old prices more heavily than new ones. This will enable us to limit the impact of short-term variations and focus on the trend that was dominating. The RWMA used weights :
The 4 most recent terms by : 100 / (4+(n-4)*1.30)
The other oldest terms by : weight_4_first_term*1.30
So the older terms are weighted 1.30 more than the more recent ones. The moving average thus traces a trend that accentuates past values and limits the noise of short-term variations.
PARAMETERS :
RSI Length : Lenght of RSI. Default is 20.
MA Type : Choice between a SMA or a RWMA which permits to minimize the impact of short term reversal. Default is RWMA.
MA Length : Length of the selected MA. Default is 19.
RSI Long Signal : Minimum value of RSI to send a LONG signal. Default is 60.
RSI Short signal : Maximum value of RSI to send a SHORT signal. Default is 40.
ROC MA Long Signal : Maximum value of Rate of Change MA to send a LONG signal. Default is 0.
ROC MA Short signal : Minimum value of Rate of Change MA to send a SHORT signal. Default is 0.
TP activation in multiple of ATR : Threshold value to trigger trailing stop Take Profit. This threshold is calculated as multiple of the ATR (Average True Range). Default value is 5 meaning that to trigger the trailing TP the price need to move 5*ATR in the right direction.
Trailing TP in percentage : Percentage value of trailing Take Profit. This Trailing TP follows the profit if it increases, remaining selected percentage below it, but stops if the profit decreases. Default is 3%.
Fixed Ratio : This is the amount of gain or loss at which the order quantity is changed. Default is 400, which means that for each $400 gain or loss, the order size is increased or decreased by a user-selected amount.
Increasing Order Amount : This is the amount to be added to or subtracted from orders when the fixed ratio is reached. The default is $200, which means that for every $400 gain, $200 is reinvested in the strategy. On the other hand, for every $400 loss, the order size is reduced by $200.
Initial capital : $1000
Fees : Interactive Broker fees apply to this strategy. They are set at 0.18% of the trade value.
Slippage : 3 ticks or $0.03 per trade. Corresponds to the latency time between the moment the signal is received and the moment the order is executed by the broker.
Important : A bot has been used to test the different parameters and determine which ones maximize return while limiting drawdown. This strategy is the most optimal on BITSTAMP:ETHUSD with a timeframe set to 6h. Parameters are set as follows :
MA type: RWMA
MA Length: 19
RSI Long Signal: >60
RSI Short Signal : <40
ROC MA Long Signal : <0
ROC MA Short Signal : >0
TP Activation in multiple ATR : 5
Trailing TP in percentage : 3
ENTER RULES :
The principle is very simple:
If the asset is overbought after a bear market, we are LONG.
If the asset is oversold after a bull market, we are SHORT.
We have defined a bear market as follows : Rate of Change (20) RWMA < 0
We have defined a bull market as follows : Rate of Change (20) RWMA > 0
The Rate of Change is calculated using this formula : (RWMA/RWMA(20) - 1)*100
Overbought is defined as follows : RSI > 60
Oversold is defined as follows : RSI < 40
LONG CONDITION :
RSI > 60 and (RWMA/RWMA(20) - 1)*100 < -1
SHORT CONDITION :
RSI < 40 and (RWMA/RWMA(20) - 1)*100 > 1
EXIT RULES FOR WINNING TRADE :
We have a trailing TP allowing us to exit once the price has reached the "TP Activation in multiple ATR" parameter, i.e. 5*ATR by default in the profit direction. TP trailing is triggered at this point, not limiting our gains, and securing our profits at 3% below this trigger threshold.
Remember that the True Range is : maximum(H-L, H-C(1), C-L(1))
with C : Close, H : High, L : Low
The Average True Range is therefore the average of these TRs over a length defined by default in the strategy, i.e. 20.
RISK MANAGEMENT :
This strategy may incur losses. The method for limiting losses is to set a Stop Loss equal to 3*ATR. This means that if the price moves against our position and reaches three times the ATR, we exit with a loss.
Sometimes the ATR can result in a SL set below 10% of the trade value, which is not acceptable. In this case, we set the SL at 10%, limiting losses to a maximum of 10%.
MONEY MANAGEMENT :
The fixed ratio method was used to manage our gains and losses. For each gain of an amount equal to the value of the fixed ratio, we increase the order size by a value defined by the user in the "Increasing order amount" parameter. Similarly, each time we lose an amount equal to the value of the fixed ratio, we decrease the order size by the same user-defined value. This strategy increases both performance and drawdown.
Enjoy the strategy and don't forget to take the trade :)

[blackcat] L1 MartinGale Scalping Strategy**MartinGale Strategy** is a popular money management strategy used in trading. It is commonly applied in situations where the trader aims to recover from a losing streak by increasing the position size after each loss.
In the MartinGale Strategy, after a losing trade, the trader doubles the position size for the next trade. This is done in the hopes that a winning trade will eventually occur, which will not only recover the previous losses but also generate a profit.
The idea behind the MartinGale Strategy is to take advantage of the law of averages. By increasing the position size after each loss, the strategy assumes that eventually, a winning trade will occur, which will not only cover the previous losses but also generate a profit. This can be especially appealing for traders looking for a quick recovery from a losing streak.
However, it is important to note that the MartinGale Strategy carries significant risks. If a trader experiences a prolonged losing streak or lacks sufficient capital, the strategy can lead to substantial losses. The strategy's reliance on the assumption of a winning trade can be dangerous, as there is no guarantee that a winning trade will occur within a certain timeframe.
Traders considering implementing the MartinGale Strategy should carefully assess their risk tolerance and thoroughly understand the potential drawbacks. It is crucial to have a solid risk management plan in place to mitigate potential losses. Additionally, traders should be aware that the strategy may not be suitable for all market conditions and may require adjustments based on market volatility.
In summary, the MartinGale Strategy is a money management strategy that involves increasing the position size after each loss in an attempt to recover from a losing streak. While it can offer the potential for quick recovery, it also comes with significant risks that traders should carefully consider before implementing it in their trading approach.
The MartinGale Scalping Strategy is a trading strategy designed to generate profits through frequent trades. It utilizes a combination of moving average crossovers and crossunders to generate entry and exit signals. The strategy is implemented in TradingView's Pine Script language.
The strategy begins by defining input variables such as take profit and stop loss levels, as well as the trading mode (long, short, or bidirectional). It then sets a rule to allow only long entries if the trading mode is set to "Long".
The strategy logic is defined using SMA (Simple Moving Average) crossover and crossunder signals. It calculates a short-term SMA (SMA3) and a longer-term SMA (SMA8), and plots them on the chart. The crossoverSignal and crossunderSignal variables are used to track the occurrence of the crossover and crossunder events, while the crossoverState and crossunderState variables determine the state of the crossover and crossunder conditions.
The strategy execution is based on the current position size. If the position size is zero (no open positions), the strategy checks for crossover and crossunder events. If a crossover event occurs and the trading mode allows long entries, a long position is entered. The entry price, stop price, take profit price, and stop loss price are calculated based on the current close price and the SMA8 value. Similarly, if a crossunder event occurs and the trading mode allows short entries, a short position is entered with the corresponding price calculations.
If there is an existing long position and the current close price reaches either the take profit price or the stop loss price, and a crossunder event occurs, the long position is closed. The entry price, stop price, take profit price, and stop loss price are reset to zero.
Likewise, if there is an existing short position and the current close price reaches either the take profit price or the stop loss price, and a crossover event occurs, the short position is closed and the price variables are reset.
The strategy also plots entry and exit points on the chart using plotshape function. It displays a triangle pointing up for a buy entry, a triangle pointing down for a buy exit, a triangle pointing down for a sell entry, and a triangle pointing up for a sell exit.
Overall, the MartinGale Scalping Strategy aims to capture small profits by taking advantage of short-term moving average crossovers and crossunders. It incorporates risk management through take profit and stop loss levels, and allows for different trading modes to accommodate different market conditions.

Long-Only Opening Range Breakout (ORB) with Pivot PointsIntraday Trading Strategy: Long-Only Opening Range Breakout (ORB) with Pivot Points
Background:
Opening Range Breakout (ORB) is a popular long-only trading strategy that capitalizes on the early morning volatility in financial markets. It's based on the idea that the initial price movements during the first few minutes or hours of the trading day can set the tone for the rest of the session. The strategy involves identifying a price range within which the asset trades during the opening period and then taking long positions when the price breaks out to the upside of this range.
Pivot Points are a widely used technical indicator in trading. They represent potential support and resistance levels based on the previous day's price action. Pivot points are calculated using the previous day's high, low, and close prices and can help traders identify key price levels for making trading decisions.
How to Use the Script:
Initialization: This script is written in Pine Script, a domain-specific language for trading strategies on the TradingView platform. To use this script, you need to have access to TradingView.
Apply the Script: You can do this by adding it to your favorites, then selecting the script in the indicators list under favorites or by searching for it by name under community scripts.
Customize Settings: The script allows you to customize various settings through the TradingView interface. These settings include:
Opening Session: You can set the time frame for the opening session.
Max Trades per Day: Specify the maximum number of long trades allowed per trading day.
Initial Stop Loss Type: Choose between using a percentage-based stop loss or the previous candles low for stop loss calculations.
Stop Loss Percentage: If you select the percentage-based stop loss, specify the percentage of the entry price for the stop loss.
Backtesting Start and End Time: Set the time frame for backtesting the strategy.
Strategy Signals:
The script will display pivot points in blue (R1, R2, R3, R4, R5) and half-pivot points in gray (R0.5, R1.5, R2.5, R3.5, R4.5) on your chart.
The green line represents the opening range.
The script generates long (buy) signals based on specific conditions:
---The open price is below the opening range high (h).
---The current high price is above the opening range high.
---Pivot point R1 is above the opening range high.
---It's a long-only strategy designed to capture upside breakouts.
---It also respects the maximum number of long trades per day.
The script manages long positions, calculates stop losses, and adjusts long positions according to the defined rules.
Trailing Stop Mechanism
The script incorporates a dynamic trailing stop mechanism designed to protect and maximize profits for long positions. Here's how it works:
1. Initialization:
The script allows you to choose between two types of initial stop loss:
---Percentage-based: This option sets the initial stop loss as a percentage of the entry price.
---Previous day's low: This option sets the initial stop loss at the previous day's low.
2. Setting the Initial Stop Loss (`sl_long0`):
The initial stop loss (`sl_long0`) is calculated based on the chosen method:
---If "Percentage" is selected, it calculates the stop loss as a percentage of the entry price.
---If "Previous Low" is selected, it sets the stop loss at the previous day's low.
3. Dynamic Trailing Stop (`trail_long`):
The script then monitors price movements and uses a dynamic trailing stop mechanism (`trail_long`) to adjust the stop loss level for long positions.
If the current high price rises above certain pivot point levels, the trailing stop is adjusted upwards to lock in profits.
The trailing stop levels are calculated based on pivot points (`r1`, `r2`, `r3`, etc.) and half-pivot points (`r0.5`, `r1.5`, `r2.5`, etc.).
The script checks if the high price surpasses these levels and, if so, updates the trailing stop accordingly.
This dynamic trailing stop allows traders to secure profits while giving the position room to potentially capture additional gains.
4. Final Stop Loss (`sl_long`):
The script calculates the final stop loss level (`sl_long`) based on the following logic:
---If no position is open (`pos == 0`), the stop loss is set to zero, indicating there is no active stop loss.
---If a position is open (`pos == 1`), the script calculates the maximum of the initial stop loss (`sl_long0`) and the dynamic trailing stop (`trail_long`).
---This ensures that the stop loss is always set to the more conservative of the two values to protect profits.
5. Plotting the Stop Loss:
The script plots the stop loss level on the chart using the `plot` function.
It will only display the stop loss level if there is an open position (`pos == 1`) and it's not a new trading day (`not newday`).
The stop loss level is shown in red on the chart.
By combining an initial stop loss with a dynamic trailing stop based on pivot points and half-pivot points, the script aims to provide a comprehensive risk management mechanism for long positions. This allows traders to lock in profits as the price moves in their favor while maintaining a safeguard against adverse price movements.
End of Day (EOD) Exit:
The script includes an "End of Day" (EOD) exit mechanism to automatically close any open positions at the end of the trading day. This feature is designed to manage and control positions when the trading day comes to a close. Here's how it works:
1. Initialization:
At the beginning of each trading day, the script identifies a new trading day using the `is_newbar('D')` condition.
When a new trading day begins, the `newday` variable becomes `true`, indicating the start of a new trading session.
2. Plotting the "End of Day" Signal:
The script includes a plot on the chart to visually represent the "End of Day" signal. This is done using the `plot` function.
The plot is labeled "DayEnd" and is displayed as a comment on the chart. It signifies the EOD point.
3. EOD Exit Condition:
When the script detects that a new trading day has started (`newday == true`), it triggers the EOD exit condition.
At this point, the script proceeds to close all open positions that may have been active during the trading day.
4. Closing Open Positions:
The `strategy.close_all` function is used to close all open positions when the EOD exit condition is met.
This function ensures that any remaining long positions are exited, regardless of their current profit or loss.
The function also includes an `alert_message`, which can be customized to send an alert or notification when positions are closed at EOD.
Purpose of EOD Exit
The "End of Day" exit mechanism serves several essential purposes in the trading strategy:
Risk Management: It helps manage risk by ensuring that positions are not left open overnight when markets can experience increased volatility.
Capital Preservation: Closing positions at EOD can help preserve trading capital by avoiding potential adverse overnight price movements.
Rule-Based Exit: The EOD exit is rule-based and automatic, ensuring that it is consistently applied without emotions or manual intervention.
Scalability: It allows the strategy to be applied to various markets and timeframes where EOD exits may be appropriate.
By incorporating an EOD exit mechanism, the script provides a comprehensive approach to managing positions, taking profits, and minimizing risk as each trading day concludes. This can be especially important in volatile markets like cryptocurrencies, where overnight price swings can be significant.
Backtesting: The script includes a backtesting feature that allows you to test the strategy's performance over historical data. Set the start and end times for backtesting to see how the long-only strategy would have performed in the past.
Trade Execution: If you choose to use this script for live trading, make sure you understand the risks involved. It's essential to set up proper risk management, including position sizing and stop loss orders.
Monitoring: Monitor the long-only strategy's performance over time and be prepared to make adjustments as market conditions change.
Disclaimer: Trading carries a risk of capital loss. This script is provided for educational purposes and as a starting point for your own long-only strategy development. Always do your own research and consider seeking advice from a qualified financial professional before making trading decisions.

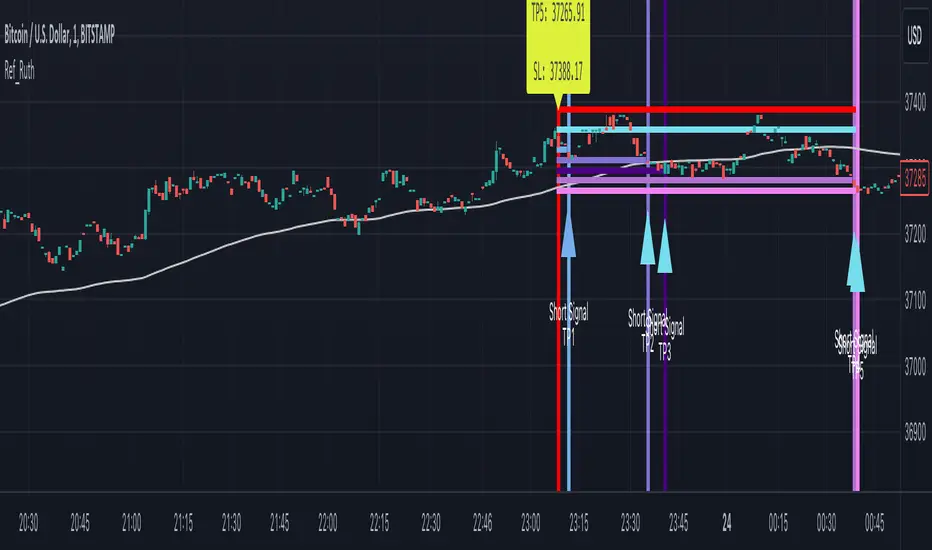
Ruth Buy/Sell Signal for Day Trade and Swing TradeRuth is based on the most known technical indicators and designed for intraday traders. Ruth's aim is to find the best Buy/Sell points and decide to stop loss point with minimum Loss also Ruth tries to find multiple Profit points as TP1/TP2/TP3/TP4/TP5. Ruth was designed based on the heat map colors to be user-friendly and easy to read. While cold color preferred for Short positions, warm colors preferred for Long positions. The most important feature of Ruth is that after the signal is generated, the candles in which the profitable levels are painted one by one with their own special color codes, so that even the most inexperienced users can understand where they should close their positions.
There are two types of signal Ruth can produce for fast trade.
Short Signal: These signals means market tends to be move to down.
Short Stop Loss Point: This is the maximum risk for the position. Shown with single red line inside of the signal.
Short Entry Point: This is the best entry price for short side position. Shown with single baby blue line inside of the signal.
Short Take Profit (TP1): This level represents the profit level the signal is most likely to reach. Shown with single blue line inside of the signal.
Short Take Profit (TP2): This level represents the profit level with a high probability of the signal occurring. Shown with single light purple line inside of the signal.
Short Take Profit (TP3): This level represents the profit level with an intermediate probability of the signal occurring. Shown with single dark purple line inside of the signal.
Short Take Profit (TP4): This level represents the profit level with a low probability of the signal occurring. Shown with single light lilac line inside of the signal.
Short Take Profit (TP5): This level represents the profit level with a tight probability of the signal occurring. Shown with single dark lilac line inside of the signal.
Long Signal: These signals means market tends to be move to up.
Long Stop Loss Point: This is the maximum risk for the position. Shown with single red line inside of the signal.
Long Entry Point: This is the best entry price for short side position. Shown with single baby blue line inside of the signal.
Long Take Profit (TP1): This level represents the profit level the signal is most likely to reach. Shown with single greenish yellow line inside of the signal.
Long Take Profit (TP2): This level represents the profit level with a high probability of the signal occurring. Shown with yellow purple line inside of the signal.
Long Take Profit (TP3): This level represents the profit level with an intermediate probability of the signal occurring. Shown with single dark yellow line inside of the signal.
Long Take Profit (TP4): This level represents the profit level with a low probability of the signal occurring. Shown with single orange line inside of the signal.
Long Take Profit (TP5): This level represents the profit level with a tight probability of the signal occurring. Shown with single dark orange line inside of the signal.
Timeframe: In general best and fastest results occurred in shorter timeframes like 1 min / 5 mins / 15 mins but feel free to try higher timeframes.
Tips & Tricks:
1) Gray line drawn ot the graph represents Dema, we suggests you to go on Short Singals under gray line and go on Long Signals upper gray line.
2) Mostly, Signals easily reach their TP2 / TP3 levels and then generally there is reaction or take profit desire so commodity price turns the opposite direction. If in short time price won't turn to Signal direction close position.
3) Don't forget, every positions has own risks and profits but trade in main trend is crucial.
CCI+EMA Strategy with Percentage or ATR TP/SL [Alifer]This is a momentum strategy based on the Commodity Channel Index (CCI), with the aim of entering long trades in oversold conditions and short trades in overbought conditions.
Optionally, you can enable an Exponential Moving Average (EMA) to only allow trading in the direction of the larger trend. Please note that the strategy will not plot the EMA. If you want, for visual confirmation, you can add to the chart an Exponential Moving Average as a second indicator, with the same settings used in the strategy’s built-in EMA.
The strategy also allows you to set internal Stop Loss and Take Profit levels, with the option to choose between Percentage-based TP/SL or ATR-based TP/SL.
The strategy can be adapted to multiple assets and timeframes:
Pick an asset and a timeframe
Zoom back as far as possible to identify meaningful positive and negative peaks of the CCI
Set Overbought and Oversold at a rough average of the peaks you identified
Adjust TP/SL according to your risk management strategy
Like the strategy? Give it a boost!
Have any questions? Leave a comment or drop me a message.
CAUTIONARY WARNING
Please note that this is a complex trading strategy that involves several inputs and conditions. Before using it in live trading, it is highly recommended to thoroughly test it on historical data and use risk management techniques to safeguard your capital. After backtesting, it's also highly recommended to perform a first live test with a small amount. Additionally, it's essential to have a good understanding of the strategy's behavior and potential risks. Only risk what you can afford to lose .
USED INDICATORS
1 — COMMODITY CHANNEL INDEX (CCI)
The Commodity Channel Index (CCI) is a technical analysis indicator used to measure the momentum of an asset. It was developed by Donald Lambert and first published in Commodities magazine (now Futures) in 1980. Despite its name, the CCI can be used in any market and is not just for commodities. The CCI compares current price to average price over a specific time period. The indicator fluctuates above or below zero, moving into positive or negative territory. While most values, approximately 75%, fall between -100 and +100, about 25% of the values fall outside this range, indicating a lot of weakness or strength in the price movement.
The CCI was originally developed to spot long-term trend changes but has been adapted by traders for use on all markets or timeframes. Trading with multiple timeframes provides more buy or sell signals for active traders. Traders often use the CCI on the longer-term chart to establish the dominant trend and on the shorter-term chart to isolate pullbacks and generate trade signals.
CCI is calculated with the following formula:
(Typical Price - Simple Moving Average) / (0.015 x Mean Deviation)
Some trading strategies based on CCI can produce multiple false signals or losing trades when conditions turn choppy. Implementing a stop-loss strategy can help cap risk, and testing the CCI strategy for profitability on your market and timeframe is a worthy first step before initiating trades.
2 — AVERAGE TRUE RANGE (ATR)
The Average True Range (ATR) is a technical analysis indicator that measures market volatility by calculating the average range of price movements in a financial asset over a specific period of time. The ATR was developed by J. Welles Wilder Jr. and introduced in his book “New Concepts in Technical Trading Systems” in 1978.
The ATR is calculated by taking the average of the true range over a specified period. The true range is the greatest of the following:
The difference between the current high and the current low.
The difference between the previous close and the current high.
The difference between the previous close and the current low.
The ATR can be used to set stop-loss orders. One way to use ATR for stop-loss orders is to multiply the ATR by a factor (such as 2 or 3) and subtract it from the entry price for long positions or add it to the entry price for short positions. This can help traders set stop-loss orders that are more adaptive to market volatility.
3 — EXPONENTIAL MOVING AVERAGE (EMA)
The Exponential Moving Average (EMA) is a type of moving average (MA) that places a greater weight and significance on the most recent data points.
The EMA is calculated by taking the average of the true range over a specified period. The true range is the greatest of the following:
The difference between the current high and the current low.
The difference between the previous close and the current high.
The difference between the previous close and the current low.
The EMA can be used by traders to produce buy and sell signals based on crossovers and divergences from the historical average. Traders often use several different EMA lengths, such as 10-day, 50-day, and 200-day moving averages.
The formula for calculating EMA is as follows:
Compute the Simple Moving Average (SMA).
Calculate the multiplier for weighting the EMA.
Calculate the current EMA using the following formula:
EMA = Closing price x multiplier + EMA (previous day) x (1-multiplier)
STRATEGY EXPLANATION
1 — INPUTS AND PARAMETERS
The strategy uses the Commodity Channel Index (CCI) with additional options for an Exponential Moving Average (EMA), Take Profit (TP) and Stop Loss (SL).
length : The period length for the CCI calculation.
overbought : The overbought level for the CCI. When CCI crosses above this level, it may signal a potential short entry.
oversold : The oversold level for the CCI. When CCI crosses below this level, it may signal a potential long entry.
useEMA : A boolean input to enable or disable the use of Exponential Moving Average (EMA) as a filter for long and short entries.
emaLength : The period length for the EMA if it is used.
2 — CCI CALCULATION
The CCI indicator is calculated using the following formula:
(src - ma) / (0.015 * ta.dev(src, length))
src is the typical price (average of high, low, and close) and ma is the Simple Moving Average (SMA) of src over the specified length.
3 — EMA CALCULATION
If the useEMA option is enabled, an EMA is calculated with the given emaLength .
4 — TAKE PROFIT AND STOP LOSS METHODS
The strategy offers two methods for TP and SL calculations: percentage-based and ATR-based.
tpSlMethod_percentage : A boolean input to choose the percentage-based method.
tpSlMethod_atr : A boolean input to choose the ATR-based method.
5 — PERCENTAGE-BASED TP AND SL
If tpSlMethod_percentage is chosen, the strategy calculates the TP and SL levels based on a percentage of the average entry price.
tp_percentage : The percentage value for Take Profit.
sl_percentage : The percentage value for Stop Loss.
6 — ATR-BASED TP AND SL
If tpSlMethod_atr is chosen, the strategy calculates the TP and SL levels based on Average True Range (ATR).
atrLength : The period length for the ATR calculation.
atrMultiplier : A multiplier applied to the ATR to set the SL level.
riskRewardRatio : The risk-reward ratio used to calculate the TP level.
7 — ENTRY CONDITIONS
The strategy defines two conditions for entering long and short positions based on CCI and, optionally, EMA.
Long Entry: CCI crosses below the oversold level, and if useEMA is enabled, the closing price should be above the EMA.
Short Entry: CCI crosses above the overbought level, and if useEMA is enabled, the closing price should be below the EMA.
8 — TP AND SL LEVELS
The strategy calculates the TP and SL levels based on the chosen method and updates them dynamically.
For the percentage-based method, the TP and SL levels are calculated as a percentage of the average entry price.
For the ATR-based method, the TP and SL levels are calculated using the ATR value and the specified multipliers.
9 — EXIT CONDITIONS
The strategy defines exit conditions for both long and short positions.
If there is a long position, it will be closed either at TP or SL levels based on the chosen method.
If there is a short position, it will be closed either at TP or SL levels based on the chosen method.
Additionally, positions will be closed if CCI crosses back above oversold in long positions or below overbought in short positions.
10 — PLOTTING
The script plots the CCI line along with overbought and oversold levels as horizontal lines.
The CCI line is colored red when above the overbought level, green when below the oversold level, and white otherwise.
The shaded region between the overbought and oversold levels is plotted as well.

Bullish and Bearish Candlestick Patterns StrategyThe strategy is a combination of candlestick pattern analysis and Fibonacci retracement levels to identify potential buy and sell signals in the market. Here's how the strategy works and how you can trade accordingly:
Candlestick Pattern Analysis:
The strategy looks for specific bullish and bearish candlestick patterns to identify potential trend reversals or continuations. The bullish patterns include:
Bullish Engulfing: This pattern occurs when a bullish candle fully engulfs the previous bearish candle.
Hammer: It is a single candlestick pattern with a small body and a long lower wick, indicating a potential bullish reversal.
Morning Star: This pattern consists of three candles, with the middle one being a small-bodied candle that gaps down and the other two being bullish candles.
The bearish patterns include:
Bearish Engulfing: Similar to the bullish engulfing, but this time, a bearish candle fully engulfs the previous bullish candle.
Shooting Star: A single candlestick pattern with a small body and a long upper wick, suggesting a potential bearish reversal.
Evening Star: This pattern is the opposite of the morning star, with a small-bodied candle that gaps up between two bearish candles.
Fibonacci Retracement Levels:
The strategy uses Fibonacci retracement levels to determine potential support and resistance levels in the market. The main level considered in this strategy is the Fibonacci 0.5 level, which is the midpoint of the previous swing move.
Trading Accordingly:
To trade using this strategy, follow these steps:
a. Observe the Chart: Apply the indicator to your preferred chart, and observe the candlestick patterns and the plotted support, resistance, and Fibonacci 0.5 levels.
b. Buy Signal: A buy signal is generated when any of the bullish candlestick patterns (Bullish Engulfing, Hammer, Morning Star) occur, and the low price of the current candle is above or equal to the Fibonacci 0.5 level. This suggests a potential bullish reversal or continuation of an existing uptrend.
c. Sell Signal: A sell signal is generated when any of the bearish candlestick patterns (Bearish Engulfing, Shooting Star, Evening Star) occur, and the high price of the current candle is below or equal to the Fibonacci 0.5 level. This indicates a potential bearish reversal or continuation of an existing downtrend.
d. Risk Management: Place stop-loss orders to protect your position in case the market moves against your trade. Consider setting the stop-loss below the recent swing low for buy trades and above the recent swing high for sell trades.
e. Take Profit: Set a target for taking profits based on your risk-reward ratio. You can use the recent swing high for buy trades as a potential target and the recent swing low for sell trades.
f. Filter Signals: Keep in mind that not all signals will result in profitable trades. It's essential to filter signals with other technical analysis tools and consider the overall market context.
Remember that no trading strategy guarantees profits, and trading always carries inherent risks. It's crucial to practice proper risk management, use appropriate position sizing, and test the strategy thoroughly in a demo environment before applying it to live trading. Additionally, consider combining this strategy with other indicators or analysis methods to make more informed .

Moving Average With Risk:Reward**Title: A Detailed Guide to Using the Moving Average With Risk:Reward Indicator**
The dynamic world of financial markets offers a myriad of opportunities for market participants to make profitable trades. However, to unlock these opportunities, traders require reliable tools to guide their decisions, tools such as technical indicators. One such indicator is the 'Moving Average With Risk:Reward' Indicator, a versatile tool that combines the simple moving average (SMA), exponential moving average (EMA), Average True Range (ATR) indicator, and automated entry, stop-loss, and take-profit markers to provide a comprehensive analysis of market trends. This article aims to detail the use and interpretation of this indicator.
**Understanding the Building Blocks**
1. **Moving Averages (SMA & EMA):**
Moving averages are arguably some of the most common tools used by traders worldwide. They help smooth out price data to form a trend following indicator. Our custom indicator utilizes both a 21-period SMA, which averages the closing prices of the past 21 periods, and a 9-period EMA, which gives more weight to recent prices. The difference in sensitivity between these two moving averages forms the basis of our trade signals.
2. **Average True Range (ATR):**
The ATR is an essential component of our indicator. It measures market volatility by decomposing the entire range of an asset price for that period. It plays a critical role in determining the stop loss and take profit levels in our indicator, as detailed later.
**How the Indicator Works**
Our custom indicator works by generating buy or sell signals based on crossover and crossunder events between the SMA and EMA. A crossover occurs when the EMA (more sensitive to recent prices) crosses above the SMA, indicating upward momentum and hence triggering a buy signal. Conversely, a crossunder, where the EMA moves below the SMA, indicates increasing downward momentum and generates a sell signal.
Upon the generation of a signal, the indicator draws lines on the chart to represent the entry point, stop loss, and take profit levels. The user has the freedom to adjust the color of these lines for visual clarity. The script will also delete previous lines whenever a new signal is generated to avoid clutter and confusion.
**Determining the Stop Loss and Take Profit Levels**
Our custom indicator uses the ATR and a predetermined multiplier to calculate stop loss and take profit levels, thus incorporating market volatility into these critical decisions. The user can input their preferred multiplier for both stop loss and take profit.
Stop Loss (SL): SL is set at a level that is the ATR value multiplied by the stop-loss multiplier subtracted from (for a long position) or added to (for a short position) the closing price.
Take Profit (TP): Conversely, TP is set at a level that is the ATR value multiplied by the take-profit multiplier added to (for a long position) or subtracted from (for a short position) the closing price.
These SL and TP levels get plotted as horizontal lines on the chart, extending to the right. Labels are also placed to easily identify these levels.
**Making the Most of the Indicator**
A significant advantage of this indicator lies in its simplicity and clarity. Traders can clearly see the entry point, stop loss, and take profit levels on the chart. They can modify these levels based on their risk tolerance or trading strategy.
The combination of SMA and EMA offers the best of both worlds, with SMA providing a lagging, stable trend indication and EMA offering a more responsive indication to recent price changes. The indicator's use of ATR for SL and TP settings also ensures that these levels adapt to changing market volatility.
It is essential to remember that while this indicator can be an invaluable tool in a trader's arsenal, it is not infallible. Markets can often behave unpredictably, and even the most robust and reliable indicators can occasionally generate false signals. Therefore, traders should always employ sound money management strategies and use this indicator in conjunction with other technical analysis tools and fundamental analysis to confirm signals and make informed trading decisions.
In conclusion, the Moving Average With Risk:Reward indicator provides a comprehensive and versatile tool that can significantly enhance trading strategies. Its integration of trend-following moving averages, volatility-adjusted stop loss and take profit levels, and clear chart visualizations make it a potent tool in the financial markets. By fully understanding how to interpret and utilize this indicator, traders can navigate the markets with increased confidence and precision.
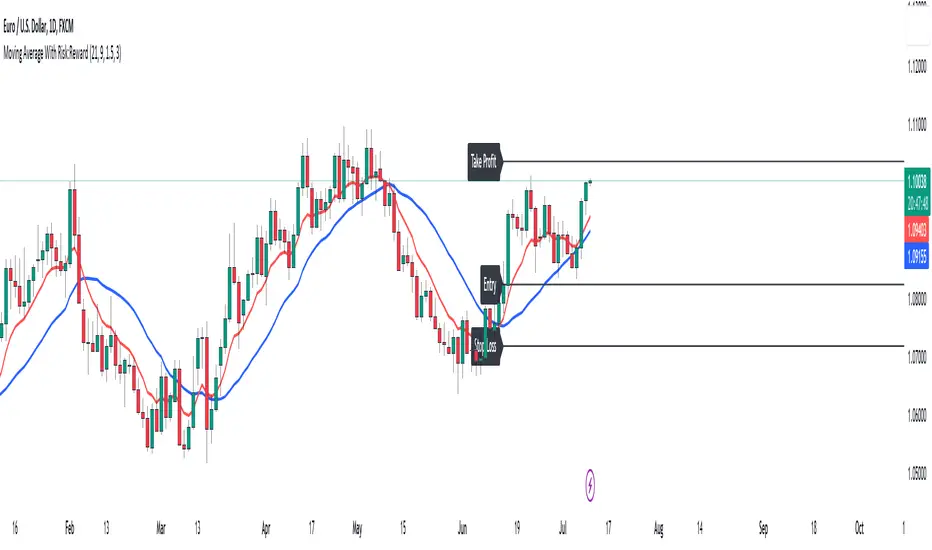
Net Unrealized Profit/Loss (NUPL)Indicator Overview
This indicator is derived from Market Value and Realized Value, which can be defined as:
Market Value: The current price of Bitcoin multiplied by the number of coins in circulation. This is like market cap in traditional markets i.e. share price multiplied by number of shares.
Realized Value: Rather than taking the current price of Bitcoin, Realized Value takes the price of each Bitcoin when it was last moved i.e. the last time it was sent from one wallet to another wallet. It then adds up all those individual prices and takes an average of them. It then multiplies that average price by the total number of coins in circulation.
By subtracting Realized Value from Market Value we calculate Unrealized Profit/Loss.
Unrealized Profit/Loss estimates the total paper profits/losses in Bitcoin held by investors. This is interesting to know but of greater value is identifying how this changes relatively over time.
To do this we can divide Unrealized Profit/Loss by Market Cap. This creates Net Unrealized Profit/Loss, sometimes referred to as NUPL, which is very useful to track investor sentiment over time for Bitcoin.
Relative Unrealised Profit/Loss is another name used for this analysis.
How To View The Chart
The key principle of this tool is in the ratio between market cap and Bitcoin investors taking profit.
When market cap rises much faster than profit taking we see that the market is overheating, one could say due to investor greed (red band). For the strategic investor such times have historically been favourable to take profit.
We can break down different percentages of Bitcoin Relative Unrealized Profit/Loss to determine what stage of the market we are in. This can be advantageous for the long term strategic investor.
Created By
Tamas Blummer, Tuur Demeester and Michiel Lescrauwaet
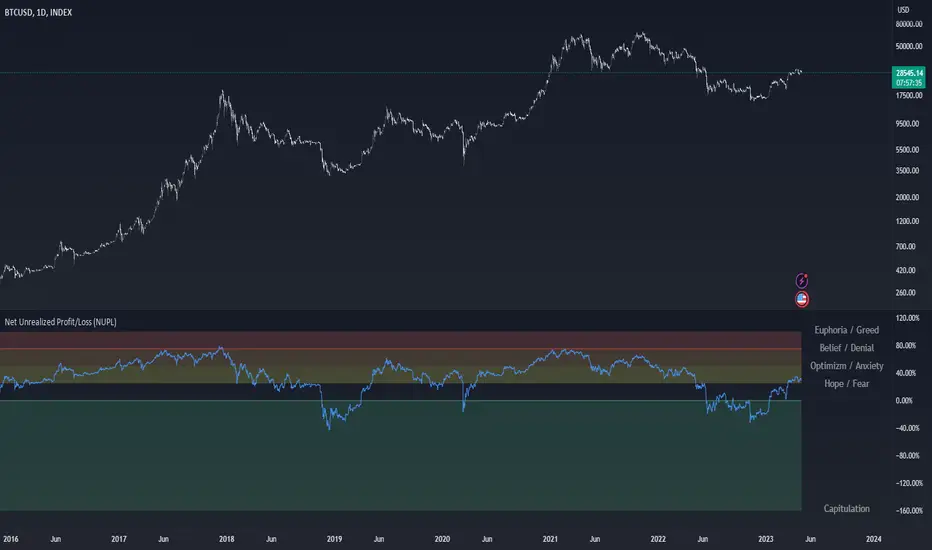
Reinforced RSI - The Quant Science This strategy was designed and written with the goal of showing and motivating the community how to integrate our 'Probabilities' module with their own script.
We have recreated one of the simplest strategies used by many traders. The strategy only trades long and uses the overbought and oversold levels on the RSI indicator.
We added stop losses and take profits to offer more dynamism to the strategy. Then the 'Probabilities' module was integrated to create a probabilistic reinforcement on each trade.
Specifically, each trade is executed, only if the past probabilities of making a profitable trade is greater than or equal to 51%. This greatly increased the performance of the strategy by avoiding possible bad trades.
The backtesting was calculated on the NASDAQ:TSLA , on 15 minutes timeframe.
The strategy works on Tesla using the following parameters:
1. Lenght: 13
2. Oversold: 40
3. Overbought: 70
4. Lookback: 50
5. Take profit: 3%
6. Stop loss: 3%
Time period: January 2021 to date.
Our Probabilities Module, used in the strategy example:

[Sniper] SuperTrend + SSL Hybrid + QQE MODHi. I’m DuDu95.
**********************************************************************************
This is the script for the series called "Sniper".
*** What is "Sniper" Series? ***
"Sniper" series is the project that I’m going to start.
In "Sniper" Series, I’m going to "snipe and shoot" the youtuber’s strategy: to find out whether the youtuber’s video about strategy is "true or false".
Specifically, I’m going to do the things below.
1. Implement "Youtuber’s strategy" into pinescript code.
2. Then I will "backtest" and prove whether "the strategy really works" in the specific ticker (e.g. BTCUSDT) for the specific timeframe (e.g. 5m).
3. Based on the backtest result, I will rate and judge whether the youtube video is "true" or "false", and then rate the validity, reliability, robustness, of the strategy. (like a lie detector)
*** What is the purpose of this series? ***
1. To notify whether the strategy really works for the people who watched the youtube video.
2. To find and build my own scalping / day trading strategy that really works.
**********************************************************************************
*** Strategy Description ***
This strategy is from " QQE MOD + supertrend + ssl hybrid" by korean youtuber "코인투데이".
"코인투데이" claimed that this strategy will make you a lot of money in any crypto ticker in 15 minute timeframe.
### Entry Logic
1. Long Entry Logic
- Super Trend Short -> Long
- close > SSL Hybrid baseline upper k
- QQE MOD should be blue
2. Short Entry Logic
- Super Trend Long -> Short
- close < SSL Hybrid baseline lower k
- QQE MOD should be red
### Exit Logic
1. Long Exit Logic
- Super Trend Long -> Short
2. Short Entry Logic
- Super Trend Short -> Long
### StopLoss
1. Can Choose Stop Loss Type: Percent, ATR, Previous Low / High.
2. Can Chosse inputs of each Stop Loss Type.
### Take Profit
1. Can set Risk Reward Ratio for Take Profit.
- To simplify backtest, I erased all other options except RR Ratio.
- You can add Take Profit Logic by adding options in the code.
2. Can set Take Profit Quantity.
### Risk Manangement
1. Can choose whether to use Risk Manangement Logic.
- This controls the Quantity of the Entry.
- e.g. If you want to take 3% risk per trade and stop loss price is 6% below the long entry price,
then 50% of your equity will be used for trade.
2. Can choose How much risk you would take per trade.
### Plot
1. Added Labels to check the data of entry / exit positions.
2. Changed and Added color different from the original one. (green: #02732A, red: #D92332, yellow: #F2E313)
3. SuperTrend and SSL Hybrid Baseline is by default drawn on the chart.
4. If you check EMA filter, EMA would be drawn on the chart.
5. Should add QQE MOD indicator manually if you want to see QQE MOD.
**********************************************************************************
*** Rating: True or False?
### Rating:
→ 3.5 / 5 (0 = Trash, 1 = Bad, 2 = Not Good, 3 = Good, 4 = Great, 5 = Excellent)
### True or False?
→ True but not a 'perfect true'.
→ It did made a small profit on 15 minute timeframe. But it made a profit so it's true.
→ It worked well in longer timeframe. I think super trend works well so I will work on this further.
### Better Option?
→ Use this for Day trading or Swing Trading, not for Scalping. (Bigger Timeframe)
→ Although the result was not good at 15 minute timeframe, it was quite profitable in 1h, 2h, 4h, 8h, 1d timeframe.
→ Crypto like BTC, ETH was ok.
→ The result was better when I use EMA filter.
### Robust?
→ Yes. Although result was super bad in 5m timeframe, backtest result was "consistently" profitable on longer timeframe (when timeframe was bigger than 15m, it was profitable).
→ Also, MDD was good under risk management option on.
**********************************************************************************
*** Conclusion?
→ I recommend you not to use this on short timeframe as the youtuber first mentioned.
→ In my opinion, I can use on longer timeframe like 2h or bigger with EMA filter, stoploss and risk management.

[Sniper] SSL Hybrid + QQE MOD + Waddah Attar StrategyHi. I’m DuDu95.
**********************************************************************************
This is the script for the series called "Sniper".
*** What is "Sniper" Series? ***
"Sniper" series is the project that I’m going to start.
In "Sniper" Series, I’m going to "snipe and shoot" the youtuber’s strategy: to find out whether the youtuber’s video about strategy is "true or false".
Specifically, I’m going to do the things below.
1. Implement "Youtuber’s strategy" into pinescript code.
2. Then I will "backtest" and prove whether "the strategy really works" in the specific ticker (e.g. BTCUSDT) for the specific timeframe (e.g. 5m).
3. Based on the backtest result, I will rate and judge whether the youtube video is "true" or "false", and then rate the validity, reliability, robustness, of the strategy. (like a lie detector)
*** What is the purpose of this series? ***
1. To notify whether the strategy really works for the people who watched the youtube video.
2. To find and build my own scalping / day trading strategy that really works.
**********************************************************************************
*** Strategy Description ***
This strategy is from "SSL QQE MOD 5MIN SCALPING STRATEGY" by youtuber "Daily Investments".
"Daily Investments" claimed that this strategy will make you some money from 100 trades in any ticker in 5 minute timeframe.
### Entry Logic
1. Long Entry Logic
- close > SSL Hybrid Baseline.
- QQE MOD should turn into blue color.
- Waddah Attar Explosion indicator must be green.
2. Short Entry Logic
- close < SSL Hybrid Baseline
- QQE MOD should turn into red color.
- Waddah Attar Explosion indicator must be red.
### Exit Logic
1. Long Exit Logic
- When QQE MOD turn into red color.
2. Short Entry Logic
- When QQE MOD turn into blue color.
### StopLoss
1. Can Choose Stop Loss Type: Percent, ATR, Previous Low / High.
2. Can Chosse inputs of each Stop Loss Type.
### Take Profit
1. Can set Risk Reward Ratio for Take Profit.
- To simplify backtest, I erased all other options except RR Ratio.
- You can add Take Profit Logic by adding options in the code.
2. Can set Take Profit Quantity.
### Risk Manangement
1. Can choose whether to use Risk Manangement Logic.
- This controls the Quantity of the Entry.
- e.g. If you want to take 3% risk per trade and stop loss price is 6% below the long entry price,
then 50% of your equity will be used for trade.
2. Can choose How much risk you would take per trade.
### Plot
1. Added Labels to check the data of entry / exit positions.
2. Changed and Added color different from the original one. (green: #02732A, red: #D92332, yellow: #F2E313)
3. SSL Hybrid Baseline is by default drawn on the chart.
4. If you check EMA filter, EMA would be drawn on the chart.
5. Should add QQE MOD and Waddah Attar Explosion indicator manually if you want to see QQE MOD.
**********************************************************************************
*** Rating: True or False?
### Rating:
→ 1.5 / 5 (0 = Trash, 1 = Bad, 2 = Not Good, 3 = Good, 4 = Great, 5 = Excellent)
### True or False?
→ False
→ Doesn't Work on 5 minute timeframe. Also, it doesn't work on crypto.
### Better Option?
→ Use this for Day trading or Swing Trading, not for Scalping. (Bigger Timeframe)
→ Although the result was bad at 5 minute timeframe, it was profitable in 1h, 2h, 4h, 8h, 1d timeframe.
→ BTC, ETH was ok.
→ The result was better when I use EMA filter (only on longer timeframe).
### Robust?
→ So So. Although result was bad in short timeframe (e.g. 30m 15m 5m), backtest result was "consistently" profitable on longer timeframe.
→ Also, MDD was not that bad under risk management option on.
**********************************************************************************
*** Conclusion?
→ Don't use this on short timeframe.
→ Better use on longer timeframe with filter, stoploss and risk management.

[MT Trader] Backtest template w/ Supertrend Strategy---EN: In this strategy template you will find some functions already pre-programmed to be used in your strategies to speed up the programming process, among them we can highlight the default stop loss and take profit functions, which will help to set easily and quickly, defining the price range in which we want to prevent large losses or protect our profits from unexpected market movements.
🔴 Stop Loss: Among the functions of the stop loss are the 4 most known, first we have the fixed percentage range (%) and price ($), when the price reaches this fixed price will limit the losses of the operation avoiding larger losses, then we have the average true range (ATR), a moving average of true range and X period that can give us good reference points to place our stop loss, finally the last point higher or lower is the most used by traders to place their stop loss.
In addition, the price range between the entry and stop loss can be converted into a trailing stop loss.
🟢 Take Profit: We have 3 options for take profit, just like stop loss, the fixed range of percentage(%) and price($), are available, in addition to this we have the 1:# ratio option, which multiplies by X number the range between the entry and stop loss to use it as take profit, perfect for strategies that use ATR or last high/low point for their strategy.
📈 Heikin Ashi Entrys: The heikin ashi entries are trades that are calculated based on heikin ashi candles but their price is executed in Japanese candles, thus avoiding the false results that occur in heikin candlestick charts, making that in certain cases better results are obtained in the strategies that are executed with this option compared to Japanese candlesticks.
📊 Dashboard: A more visual and organized way to see the results and data needed for our strategy.
Feel free to use this template to program your own strategies, if you find bugs or want to request a new feature let me know in the comments or through my telegram @hvert_mt
__________________________________________________________________________________________________________________________________________________
---ES: En esta plantilla de estrategia podrás encontrar algunas funciones ya pre-programadas para ser usadas en tus estrategias para acelerar procesos de programación, entre ellas podemos destacar las funciones por defecto de stop loss y take profit, que ayudaran a establecer de manera fácil y rápida, definiendo los rango de precio en los que queremos prevenirnos de perdidas grandes o proteger nuestras ganancias de movimientos inesperados del mercado.
🔴 Stop Loss: Entre las funciones del stop loss están las 4 más conocidas, en primer lugar tenemos el rango de porcentaje fijo(%) y el precio($), cuando el precio alcance este precio fijo se limitaran las perdidas de la operación evitando perdidas mas grandes, después tenemos el promedio de rango verdadero(ATR), una media móvil del rango verdadero y X periodo que nos puede dar buenos puntos de referencia para colocar nuestro stop loss, por ultimo el ultimo punto mas alto o mas bajo es de los mas usados por los traders para colocar su stop loss.
Adicional a esto, el rango de precio entre la entrada y el stop loss se puede convertir en un trailing stop loss.
🟢 Take Profit: Tenemos 3 opciones para take profit, al igual que en el stop loss, el rango fijo de porcentaje(%) y precio($) se encuentran disponibles, adicional a esto tenemos la opción de ratio 1:#, que multiplica por X numero el rango entre la entrada y el stop loss para usarlo como take profit, perfecto para estrategias que usen ATR o ultimo punto alto/bajo.
📈 Entradas Heikin Ashi: Las entradas Heikin Ashi son trades que son calculados en base a las velas Aeikin Ashi pero su precio esta ejecutado a velas japonesas, evitando así los falsos resultados que se producen en graficas de velas Heikin, esto haciendo que en ciertos casos se obtengan mejores resultados en las estrategias que son ejecutadas con esta opción en comparación con las velas japonesas.
📊 Panel de Control: Una manera mas visual y organizada de ver los resultados y datos necesarios de nuestra estrategia.
Siéntete libre de usar esta plantilla para programar tus propias estrategias, si encuentras errores o quieres solicitar una nueva función házmelo saber en los comentarios o a través de mi Telegram: @hvert_mt

GRID SPOT TRADING ALGORITHM - GRID BOT TRADING STRATEGYGRID SPOT TRADING ALGORITHM : LONG ONLY STRATEGY OPEN SOURCE
This is a long only strategy for spot assets.
HOW IT WORKS
Grid trading is a trading strategy where an investor creates a so-called "price grid". The basic idea of the strategy is to repeatedly buy at the pre-specified price and then wait for the price to rise above that level and then sell the position (and vice versa with shorting or hedging).
FEATURES
Grids: This algorithm has a total of 10 grids.
Take profit: The trader can increase or decrease the distance between the grids from the User Interface panel, the distance between one grid and another represents the take profit.
Management: The algorithm buys 10% of the capital every time the price breaks down a grid and sells during a rise to the next higher grid. The initial capital is invested in 10 sizes which represent 10% of the capital per trade.
Stop Loss: The algorithm knows no stop loss as long as it is not activated from the User Interface panel. By activating the stop loss from the User Interface panel the algorithm will insert a close condition on all trades which will be calculated from the last lower grid.
Trades: Trades are opened only if the price is within the grid. If the market leaves the grid the algorithm will not buy new positions or sell new positions.
Optimal market conditions: The favorable market for this algorithm is the sideways market.
LIMITATIONS OF THE MODEL
The trader must take into account that this is a static model. It only works perfectly well if the market is in a sideways phase and incurs heavy losses if the market takes a downward trend. The model is unusable for an uptrend. The trader must therefore carefully analyze the market where he intends to use this strategy, making sure that the price is in a sideways phase.
USES
Indispensable research and backtesting tool for those using bots for their investments. The algorithm produces a backtesting of the strategy for past history. It is used by professional traders to understand if this strategy has been profitable on a market and what parameters to use for bots using this strategy (Kucoin, Binance etc.).
If you would like to develop your own algorithm with customized conditions based on a grid strategy, please contact us.
If you need help in using this tool, please contact us without hesitation.

Double SupertrendThis strategy is based on a custom indicator that was created based on the Supertrend indicator. At its core, there are always 2 super trend indicators with different factors to reduce market noise (false signals).
The strategy/indicator has some parameters to improve the signals and filters.
TECHNICAL ANALYSIS
☑ Show Indicators
This option will enable/disable the Supertrend indicators on the chart.
☑ Length
The length will be used on the Supertrend Indicator to calculate its values.
☑ Dev Fast
The fast deviation or factor from one of the super trend indicators. This will be the leading indicator for entry signals, as well as for the exit signals.
☑ Dev Slow
The slow deviation or factor from one of the super trend indicators. This will be the confirmation indicator for entry and exit signals.
☑ Exit Type
It's possible to select from 4 options for the exit signals. Exit signals always take profit target.
☑ ⥹ Reversals
This option will make the strategy/indicator calculate the exit signals based on the difference between the given period's highest and lowest candle value (see Period on this list). It's displayed on the chart with the cross. As it's possible to verify in the image below, there are multiple exit spots for every entry.
☑ ⥹ ATR
Using ATR as a base indicator for exit signals will make the strategy/indicator place limit/stop orders. Candle High + ATR for longs, Candle Low - ATR for shorts. The strategy will show the ATR level for take profit and stick with it until the next signal. This way, the take profit value remains based on the candle of the entry signal.
☑ ⥹ Fast Supertrend
With this option selected, the exit signals will be based on the Fast Supertsignal value, mirrored to make a profit.
☑ ⥹ Slow Supertrend
With this option selected, the exit signals will be based on the Slow Supertsignal value, which is mirrored to take profit.
☑ Period
This will represent the number of candles used on the exit signals when Reversals is selected as Exit Type. It's also used to calculate the gradient used on the Fills and Supertrend signals.
☑ Multiplier
It's used on the take profit when the ATR option is selected on the Exit Type.
STRATEGY
☑ Use The Strategy
This will enable/disable the strategy to show the trades calculations.
☑ Show Use Long/Short Entries
Option to make the strategy show/use Long or Short signals. Available only if Use The Strategy is enabled
☑ Show Use Exit Long/Short
Option to make the strategy show/use Exit Long or Short signals (valid when Reversals option is selected on the Exit Type). Available only if Use The Strategy is enabled
☑ Show Use Add Long/Short
Option to make the strategy show/use Add Long or Short signals. With this option enabled, the strategy will place multiple trades in the same direction, almost the same concept as a pyramiding parameter. It's based on the Fast Supersignal when the candle fails to cross and reverses. Available only if Use The Strategy is enabled
☑ Trades Date Start/End
The date range that the strategy will check the market data and make the trades
HOW TO USE
It's very straightforward. A long signal will appear as a green arrow with a text Long below it. A short signal will appear as a red arrow with a text Short above it. It's ideal to wait for the candle to finish to validate the signal.
The exit signals are optional but give a good idea of the configuration used when backtesting. Each market and timeframe will have its own configuration for the best results. On average, sticking to ATR as an exit signal will have less risk than the other options.
☑ Entry Signals
Follow the arrows with Long/Short texts on them. Wait for the signal candle to close to validate the entry.
☑ Exit Signals
Use them to close your position or to trail stop your orders and maximize profits. Select the exit type suitable for each timeframe and market
☑ Add Entries
It's possible to increase the position following the add margin/contracts based on the Add signals. Not mandatory, but may work as reentries or late entries using the same signal.
☑ What about Stop Loss?
The stop-loss levels were not included as a separated signal because it's already in the chart. There are some possible ideas for the stop loss:
☑⥹ Candle High/Low (2nd recommend option)
When it's a Long signal from the entry signal candle, the stop loss can be the Low value of the same candle. Very tight stop loss in some cases, depending on the candle range
☑⥹ Local Top/Bottom
Selecting the local top/bottom as stop loss will give the strategy more room for false breakouts or reversals, keeping the trade open and minimizing noises. Increases the risk
☑⥹ Fast Supertrend (1st recommend option)
The fast supertrend can be used as stop-loss as well. making it a moving level and working close to trail stop management
☑⥹ Fixed Percentage
It's possible to use a fixed risk percentage for the trades, making the risk easier to control and project. Since the market volatility is not fixed, this may affect the accuracy of the trades
☑⥹ Based on the ATR (3rd recommend option)
When the exit type option ATR is selected, it will display the take profit level for that entry. Just mirror that value and put it as stop-loss, or multiply that amount by 1.5 to have more room for market noise.
EXAMPLE CONFIGURATIONS
Here are some configuration ideas for some markets (all of them are from crypto, especially futures markets)
BTCUSDT 15min - Default configuration
BTCUSDT 1h - Length 10 | Dev Fast 3 | Dev Slow 4 | Exit Type ATR | Period 50 | Multiplier 1
BTCUSDT 4h - Length 10 | Dev Fast 2 | Dev Slow 4 | Exit Type ATR | Period 50 | Multiplier 1
ETHUSDT 15min - Length 20 | Dev Fast 1 | Dev Slow 3 | Exit Type Fast Supertrend | Period 50 | Multiplier 1
IOTAUSDT 15min - Length 10 | Dev Fast 1 | Dev Slow 2 | Exit Type Slow Supertrend | Period 50 | Multiplier 1
OMGUSDT 15min - Length 10 | Dev Fast 1 | Dev Slow 4 | Exit Type Slow Supertrend | Period 50 | Multiplier 1
VETUSDT 15min - Length 10 | Dev Fast 3 | Dev Slow 4 | Exit Type Slow Supertrend | Period 50 | Multiplier 1
HOW TO FIND OTHER CONFIGURATIONS
Here are some steps to find suitable configurations
select a market and time frame
enable the Use This Strategy option on the strategy
open the strategy tester panel and select the performance summary
open the strategy configuration and go to properties
change the balance to the same price of the symbol (example: BTCUSDT 60.000, use 60.000 as balance)
go back to the inputs tab and keep changing the parameters until you see the net profit be positive and bigger than the absolute value of the drawdown
in case you can't find a suitable configuration, try other timeframes
Since the tester reflects what happened in the past candles, it's not guaranteed to give the same results. However, this indicator/Strategy can be used with other indicators as a leading signal or confirmation signal.
